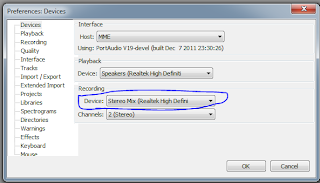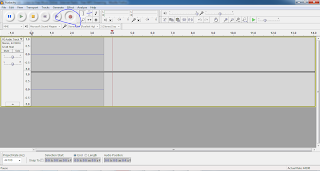
After launching the DirectX Diagnostic utility, the version will be listed.

See Also,
Windows Crash Dump Analysis
Troubleshooting 0x116 VIDEO_TDR_ERROR
Mike's Technology and Finance Blog covers a number of different topics in finance and technology. Most technical posts provide architecture, development, implementation, troubleshooting techniques for different Enterprise IT systems that run on the Windows, UNIX, and Linux platforms. Some posts also include my personal opinions and rants.


# for hex 0xc000000f / decimal -1073741809 :
  STATUS_NO_SUCH_FILE                                  ntstatus.h
# {File Not Found}
# The file %hs does not exist.
  USBD_STATUS_NOT_ACCESSED                             usb.h
# 2 matches found for "c000000f"


3: kd> !analyze -v
*******************************************************************************
*                                                                             *
*                        Bugcheck Analysis                                    *
*                                                                             *
*******************************************************************************

PFN_LIST_CORRUPT (4e)
Typically caused by drivers passing bad memory descriptor lists (ie: calling
MmUnlockPages twice with the same list, etc).  If a kernel debugger is
available get the stack trace.
Arguments:
Arg1: 0000000000000099, A PTE or PFN is corrupt
Arg2: 0000000000099cdb, page frame number
Arg3: 0000000000000005, current page state
Arg4: 0000000000000000, 0

Debugging Details:
------------------


BUGCHECK_STR:  0x4E_99

CUSTOMER_CRASH_COUNT:  1

DEFAULT_BUCKET_ID:  VISTA_DRIVER_FAULT

PROCESS_NAME:  witcher2.exe

CURRENT_IRQL:  2

LAST_CONTROL_TRANSFER:  from fffff80003117d7c to fffff8000308ec40

STACK_TEXT:
... : nt!KeBugCheckEx
... : nt!MiBadShareCount+0x4c
... : nt! ?? ::FNODOBFM::`string'+0x333ca
... : nt!MiDeleteAddressesInWorkingSet+0x307
... : nt!MmCleanProcessAddressSpace+0x96
... : nt!PspExitThread+0x56a
... : nt!PsExitSpecialApc+0x1d
... : nt!KiDeliverApc+0x2ca
... : nt!KiInitiateUserApc+0x70
... : nt!KiSystemServiceExit+0x9c
... : 0x74b82e09


STACK_COMMAND:  kb

FOLLOWUP_IP:
nt!MiBadShareCount+4c
fffff800`03117d7c cc              int     3

SYMBOL_STACK_INDEX:  1

SYMBOL_NAME:  nt!MiBadShareCount+4c

FOLLOWUP_NAME:  MachineOwner

MODULE_NAME: nt

DEBUG_FLR_IMAGE_TIMESTAMP:  4e02aaa3

IMAGE_NAME:  memory_corruption

FAILURE_BUCKET_ID:  X64_0x4E_99_nt!MiBadShareCount+4c

BUCKET_ID:  X64_0x4E_99_nt!MiBadShareCount+4c

Followup: MachineOwner
---------
Troubleshooting this error involves testing the RAM and identifying possible issues with the hard drive using vendor supplied diagnostic utilities or looking at the SMART statistics. If a hardware issue is identified, the failing component should be replaced (in the case of a hard drive, it may be desirable to rescue the data to a flash drive or other external hard drive). Once a hardware issue is ruled out, the next stage is to try to identify the corrupting driver by enabling driver verifier (and looking at the associated verifier-enabled memory dumps). If any file corruption exists with critical system files, it may be necessary to check the filesystem and repair the damaged files offline.
kd> !analyze -v
*******************************************************************************
*                                                                             *
*                        Bugcheck Analysis                                    *
*                                                                             *
*******************************************************************************

MACHINE_CHECK_EXCEPTION (9c)
A fatal Machine Check Exception has occurred.
KeBugCheckEx parameters;
    x86 Processors
        If the processor has ONLY MCE feature available (For example Intel
        Pentium), the parameters are:
        1 - Low  32 bits of P5_MC_TYPE MSR
        2 - Address of MCA_EXCEPTION structure
        3 - High 32 bits of P5_MC_ADDR MSR
        4 - Low  32 bits of P5_MC_ADDR MSR
        If the processor also has MCA feature available (For example Intel
        Pentium Pro), the parameters are:
        1 - Bank number
        2 - Address of MCA_EXCEPTION structure
        3 - High 32 bits of MCi_STATUS MSR for the MCA bank that had the error
        4 - Low  32 bits of MCi_STATUS MSR for the MCA bank that had the error
    IA64 Processors
        1 - Bugcheck Type
            1 - MCA_ASSERT
            2 - MCA_GET_STATEINFO
                SAL returned an error for SAL_GET_STATEINFO while processing MCA.
            3 - MCA_CLEAR_STATEINFO
                SAL returned an error for SAL_CLEAR_STATEINFO while processing MCA.
            4 - MCA_FATAL
                FW reported a fatal MCA.
            5 - MCA_NONFATAL
                SAL reported a recoverable MCA and we don't support currently
                support recovery or SAL generated an MCA and then couldn't
                produce an error record.
            0xB - INIT_ASSERT
            0xC - INIT_GET_STATEINFO
                  SAL returned an error for SAL_GET_STATEINFO while processing
                  INIT event.
            0xD - INIT_CLEAR_STATEINFO
                  SAL returned an error for SAL_CLEAR_STATEINFO while processing
                  INIT event.
            0xE - INIT_FATAL
                  Not used.
        2 - Address of log
        3 - Size of log
        4 - Error code in the case of x_GET_STATEINFO or x_CLEAR_STATEINFO
    AMD64 Processors
        1 - Bank number
        2 - Address of MCA_EXCEPTION structure
        3 - High 32 bits of MCi_STATUS MSR for the MCA bank that had the error
        4 - Low  32 bits of MCi_STATUS MSR for the MCA bank that had the error
Arguments:
Arg1: 00000000
Arg2: 8054e170
Arg3: b2000000
Arg4: 1040080f

Debugging Details:
------------------

   NOTE:  This is a hardware error.  This error was reported by the CPU
   via Interrupt 18.  This analysis will provide more information about
   the specific error.  Please contact the manufacturer for additional
   information about this error and troubleshooting assistance.

   This error is documented in the following publication:

      - IA-32 Intel(r) Architecture Software Developer's Manual
        Volume 3: System Programming Guide

   Bit Mask:

       MA                           Model Specific       MCA
    O  ID      Other Information      Error Code     Error Code
   VV  SDP ___________|____________ _______|_______ _______|______
   AEUECRC|                        |               |              |
   LRCNVVC|                        |               |              |
   ^^^^^^^|                        |               |              |
      6         5         4         3         2         1
   3210987654321098765432109876543210987654321098765432109876543210
   ----------------------------------------------------------------
   1011001000000000000000000000000000010000010000000000100000001111


VAL   - MCi_STATUS register is valid
        Indicates that the information contained within the IA32_MCi_STATUS
        register is valid.  When this flag is set, the processor follows the
        rules given for the OVER flag in the IA32_MCi_STATUS register when
        overwriting previously valid entries.  The processor sets the VAL
        flag and software is responsible for clearing it.

UC    - Error Uncorrected
        Indicates that the processor did not or was not able to correct the
        error condition.  When clear, this flag indicates that the processor
        was able to correct the error condition.

EN    - Error Enabled
        Indicates that the error was enabled by the associated EEj bit of the
        IA32_MCi_CTL register.

PCC   - Processor Context Corrupt
        Indicates that the state of the processor might have been corrupted
        by the error condition detected and that reliable restarting of the
        processor may not be possible.

BUSCONNERR - Bus and Interconnect Error   BUS{LL}_{PP}_{RRRR}_{II}_{T}_err
        These errors match the format 0000 1PPT RRRR IILL


   Concatenated Error Code:
   --------------------------
   _VAL_UC_EN_PCC_BUSCONNERR_F

   This error code can be reported back to the manufacturer.
   They may be able to provide additional information based upon
   this error.  All questions regarding STOP 0x9C should be
   directed to the hardware manufacturer.

BUGCHECK_STR:  0x9C_GenuineIntel

CUSTOMER_CRASH_COUNT:  1

DEFAULT_BUCKET_ID:  DRIVER_FAULT

LAST_CONTROL_TRANSFER:  from 806f48db to 80533846

SYMBOL_ON_RAW_STACK:  1

STACK_ADDR_RAW_STACK_SYMBOL: ffffffff8054e1dc

STACK_COMMAND:  dds FFFFFFFF8054E1DC-0x20 ; kb

STACK_TEXT:
8054e1bc  00000000
8054e1c0  00000000
8054e1c4  00000000
8054e1c8  00000000
8054e1cc  00000000
8054e1d0  ffdffc50
8054e1d4  00000000
8054e1d8  ba4e9162 intelppm+0x2162
8054e1dc  00000000
8054e1e0  80550f40 nt!KiDoubleFaultStack+0x2cc0
8054e1e4  00000000
8054e1e8  80550f38 nt!KiDoubleFaultStack+0x2cb8
8054e1ec  00000000
8054e1f0  00000046
8054e1f4  00000000
8054e1f8  806efe18 hal!HalpClockInterrupt+0xe4
8054e1fc  00000000
8054e200  00000000
8054e204  00000000
8054e208  00321213
8054e20c  00000000
8054e210  00000000
8054e214  00000000
8054e218  00000000
8054e21c  00000000
8054e220  00000000
8054e224  00000000
8054e228  00000000
8054e22c  00000000
8054e230  00000000
8054e234  00000000
8054e238  00000000


FOLLOWUP_IP:
intelppm+2162
ba4e9162 ??              ???

SYMBOL_NAME:  intelppm+2162

FOLLOWUP_NAME:  MachineOwner

MODULE_NAME: intelppm

IMAGE_NAME:  intelppm.sys

DEBUG_FLR_IMAGE_TIMESTAMP:  48025183

FAILURE_BUCKET_ID:  0x9C_GenuineIntel_intelppm+2162

BUCKET_ID:  0x9C_GenuineIntel_intelppm+2162

Followup: MachineOwner
---------

kd> lmvm intelppm
start    end        module name
ba4e7000 ba4efe00   intelppm T (no symbols)
    Loaded symbol image file: intelppm.sys
    Image path: \SystemRoot\system32\DRIVERS\intelppm.sys
    Image name: intelppm.sys
    Timestamp:        Sun Apr 13 12:31:31 2008 (48025183)
    CheckSum:         0000C894
    ImageSize:        00008E00
    Translations:     0000.04b0 0000.04e4 0409.04b0 0409.04e4
From this particular dump, we can tell that there was an error involving the bus. Analyzing Machine Check Architecture Error Codes involves looking at Volume 3 of the Intel Architecture Software Developer's Manual (or examining the appropriate developer's guide for other vendors, such as the Bios/Kernel Developer's Guides for AMD processors). This is an Intel chip, and in this case, bits 19-24 (the bits that indicate the model specific error) are 001000. This indicates an error of type BQ_DCU_WB_TYPE. Further research indicates that this is a failure of the processor to write a line back to memory. Still we don't know whether the processor or motherboard failed, and to determine this would require running vendor supplied diagnostic tools for the system or examining repeated errors.


# for hex 0xc0000135 / decimal -1073741515 :
  STATUS_DLL_NOT_FOUND                         ntstatus.h
# {Unable To Locate Component}
# This application has failed to start because %hs was not
# found. Re-installing the application may fix this problem.
# 1 matches found for "0xc0000135"
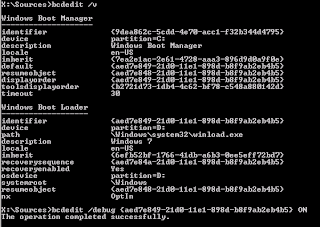
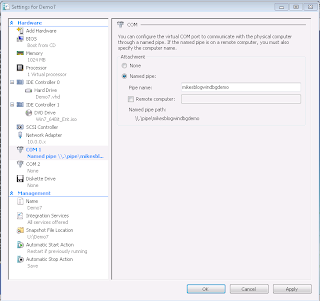
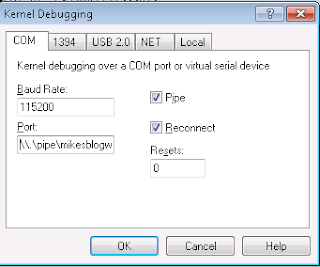
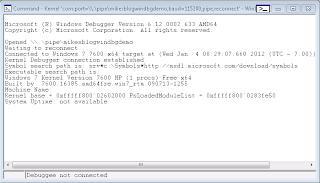
Attaching to a live debugging session, we can get more information about what went wrong, in this case the missing file is identified in the "Probably caused by" line near the start of the debug session. In my case I deleted gdi32.dll on purpose to recreate the error, the missing file on your system will probably be different:
*** Fatal System Error: 0xc0000135
                       (0xFFFFF8A00050ED60,0xFFFFF8A002A54B90,
                        0x0000000000000000,0x0000000000000000)


STOP: c0000135 The program can't start because (null) is missing
from your computer. Try reinstalling the program to fix this problem.
Break instruction exception - code 80000003 (first chance)

A fatal system error has occurred.
Debugger entered on first try; Bugcheck callbacks have not been invoked.

A fatal system error has occurred.

Connected to Windows 7 7600 x64 target at (Wed Jan  4 08:30:19.860 2012 (UTC - 7:00)), ptr64 TRUE
Loading Kernel Symbols
...............................................................
............................................
Loading User Symbols

Loading unloaded module list
........
*******************************************************************************
*                                                                             *
*                        Bugcheck Analysis                                    *
*                                                                             *
*******************************************************************************

Use !analyze -v to get detailed debugging information.

BugCheck C0000135, {fffff8a00050ed60, fffff8a002a54b90, 0, 0}

Probably caused by : GDI32.dll

Followup: MachineOwner
---------

nt!DbgBreakPointWithStatus:
fffff800`0266bf60 cc              int     3
We can gain more information by running a !analyze -v:kd> !analyze -v ******************************************************************************* * * * Bugcheck Analysis * * * ******************************************************************************* Unknown bugcheck code (c0000135) Unknown bugcheck description Arguments: Arg1: fffff8a00050ed60 Arg2: fffff8a002a54b90 Arg3: 0000000000000000 Arg4: 0000000000000000 Debugging Details: ------------------ ERROR_CODE: (NTSTATUS) 0xc0000135 - The program can't start because %hs
is missing from your computer. Try
                                    reinstalling the program to fix this problem.

EXCEPTION_CODE: (NTSTATUS) 0xc0000135 - The program can't start because %hs is
missing from your computer. Try
reinstalling the program to fix
                                        this problem.

EXCEPTION_PARAMETER1:  fffff8a00050ed60

EXCEPTION_PARAMETER2:  fffff8a002a54b90

EXCEPTION_PARAMETER3:  0000000000000000

EXCEPTION_PARAMETER4: 0

BUGCHECK_STR:  STATUS_DLL_NOT_FOUND

IMAGE_NAME:  GDI32.dll

DEBUG_FLR_IMAGE_TIMESTAMP:  0

MODULE_NAME: GDI32

FAULTING_MODULE: 0000000000000000

DEFAULT_BUCKET_ID:  VISTA_DRIVER_FAULT

PROCESS_NAME:  System

CURRENT_IRQL:  2

LAST_CONTROL_TRANSFER:  from fffff800027696d2 to fffff8000266bf60

STACK_TEXT:
... : nt!DbgBreakPointWithStatus
... : nt!KiBugCheckDebugBreak+0x12
... : nt!KeBugCheck2+0x71e
... : nt!KeBugCheckEx+0x104
... : nt!PopGracefulShutdown+0x257
... : nt!NtSetSystemPowerState+0x864
... : nt!KiSystemServiceCopyEnd+0x13
... : nt!KiServiceLinkage
... : nt!PopIssueActionRequest+0x1d9
... : nt!PopPolicyWorkerAction+0x4c
... : nt!PopPolicyWorkerThread+0xfd
... : nt!ExpWorkerThread+0x111
... : nt!PspSystemThreadStartup+0x5a
... : nt!KxStartSystemThread+0x16


STACK_COMMAND:  kb

FOLLOWUP_NAME:  MachineOwner

FAILURE_BUCKET_ID:  X64_STATUS_DLL_NOT_FOUND_VRF_IMAGE_GDI32.dll

BUCKET_ID:  X64_STATUS_DLL_NOT_FOUND_VRF_IMAGE_GDI32.dll

Followup: MachineOwner
---------
We have an undocumented bugcheck, so we need to make a couple of educated guesses to look at the parameters. I looked at parameter 1 and parameter 2 using the da (Display Memory - ASCII) debugger command.
kd> da fffff8a00050ed60
fffff8a0`0050ed60  "GDI32.dll"
kd> da fffff8a002a54b90
fffff8a0`02a54b90  "C:\Windows\system32;C:\Windows\s"
fffff8a0`02a54bb0  "ystem32;C:\Windows;C:\Windows\Sy"
fffff8a0`02a54bd0  "stem32\Wbem;C:\Windows\System32\"
fffff8a0`02a54bf0  "WindowsPowerShell\v1.0\"
Parameter 1 is clearly the missing DLL and parameter 2 appears to be the DLL search path that was searched to find the DLL. The resolution is fairly straightforward, the missing file needs to be restored in some way. This may be as easy as an offline integrity check, or as hard as needing to copy the files from a working system to a flash drive and copying them into place with a Linux Live CD (basically reversing this procedure to put files onto the system instead of take them off). Some users may find it simplest to rescue their files and reinstall Windows, or at least perform an in place upgrade.



# for hex 0xc0000034 / decimal -1073741772 :
  STATUS_OBJECT_NAME_NOT_FOUND                         ntstatus.h
# Object Name not found.
# 1 matches found for "c0000034"
From the minidump it is impossible to tell what was missing,...
kd> !analyze -v
*******************************************************************************
*                                                                             *
*                        Bugcheck Analysis                                    *
*                                                                             *
*******************************************************************************

PROCESS1_INITIALIZATION_FAILED (6b)
Arguments:
Arg1: ffffffffc0000034, Indicates the NT status code that caused the failure.
Arg2: 0000000000000002, (reserved)
Arg3: 0000000000000000
Arg4: 0000000000000000

Debugging Details:
------------------


CUSTOMER_CRASH_COUNT:  1

DEFAULT_BUCKET_ID:  VISTA_DRIVER_FAULT

BUGCHECK_STR:  0x6B

PROCESS_NAME:  System

CURRENT_IRQL:  0

LAST_CONTROL_TRANSFER:  from fffff80002ac231d to fffff8000267df00

STACK_TEXT:
... : nt!KeBugCheckEx
... : nt!PsLocateSystemDlls+0xbd
... : nt!IoInitSystem+0x85d
... : nt!Phase1InitializationDiscard+0x1290
... : nt!Phase1Initialization+0x9
... : nt!PspSystemThreadStartup+0x5a
... : nt!KxStartSystemThread+0x16


STACK_COMMAND:  kb

FOLLOWUP_IP:
nt!PsLocateSystemDlls+bd
fffff800`02ac231d cc              int     3

SYMBOL_STACK_INDEX:  1

SYMBOL_NAME:  nt!PsLocateSystemDlls+bd

FOLLOWUP_NAME:  MachineOwner

MODULE_NAME: nt

IMAGE_NAME:  ntkrnlmp.exe

DEBUG_FLR_IMAGE_TIMESTAMP:  4a5bc600

FAILURE_BUCKET_ID:  X64_0x6B_nt!PsLocateSystemDlls+bd

BUCKET_ID:  X64_0x6B_nt!PsLocateSystemDlls+bd

Followup: MachineOwner
---------
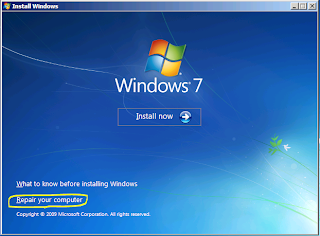
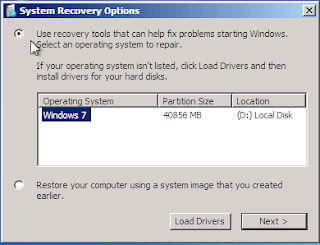
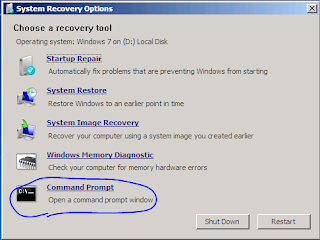
The fix was easy, running startup repair fixed the problem fairly immediately:
Startup Repair diagnosis and repair log --------------------------- Last successful boot time: 12/30/2011 9:24:54 PM (GMT) Number of repair attempts: 1 Session details --------------------------- System Disk = \Device\Harddisk0 Windows directory = D:\Windows AutoChk Run = 0 Number of root causes = 1 Test Performed: --------------------------- Name: Check for updates Result: Completed successfully. Error code = 0x0 Time taken = 0 ms Test Performed: --------------------------- Name: System disk test Result: Completed successfully. Error code = 0x0 Time taken = 0 ms Test Performed: --------------------------- Name: Disk failure diagnosis Result: Completed successfully. Error code = 0x0 Time taken = 0 ms Test Performed: --------------------------- Name: Disk metadata test Result: Completed successfully. Error code = 0x0 Time taken = 47 ms Test Performed: --------------------------- Name: Target OS test Result: Completed successfully. Error code = 0x0 Time taken = 31 ms Test Performed: --------------------------- Name: Volume content check Result: Completed successfully. Error code = 0x0 Time taken = 188 ms Test Performed: --------------------------- Name: Boot manager diagnosis Result: Completed successfully. Error code = 0x0 Time taken = 62 ms Test Performed: --------------------------- Name: System boot log diagnosis Result: Completed successfully. Error code = 0x0 Time taken = 0 ms Test Performed: --------------------------- Name: Event log diagnosis Result: Completed successfully. Error code = 0x0 Time taken = 94 ms Test Performed: --------------------------- Name: Internal state check Result: Completed successfully. Error code = 0x0 Time taken = 0 ms Test Performed: --------------------------- Name: Boot status test Result: Completed successfully. Error code = 0x0 Time taken = 0 ms Test Performed: --------------------------- Name: Setup state check Result: Completed successfully. Error code = 0x0 Time taken = 453 ms Test Performed: --------------------------- Name: Registry hives test Result: Completed successfully. Error code = 0x0 Time taken = 3453 ms Test Performed: --------------------------- Name: Windows boot log diagnosis Result: Completed successfully. Error code = 0x0 Time taken = 16 ms Test Performed: --------------------------- Name: Bugcheck analysis Result: Completed successfully. Error code = 0x0 Time taken = 828 ms Root cause found: --------------------------- Bugcheck 6b. Parameters = 0xffffffffc0000034, 0x2, 0x0, 0x0. Boot critical file d:\windows\system32\ntdll.dll is missing. Repair action: File repair Result: Completed successfully. Error code = 0x0 Time taken = 6469 ms --------------------------- ---------------------------
For other cases, it may be necessary to perform further analysis as to why the file disappeared (possibly due to memory or hard drive issues). For most cases, running startup repair or an offline integrity verification should be enough to restore the file and get the system running again.
2: kd> !analyze -v
*******************************************************************************
*                                                                             *
*                        Bugcheck Analysis                                    *
*                                                                             *
*******************************************************************************

CRITICAL_STRUCTURE_CORRUPTION (109)
This bugcheck is generated when the kernel detects that critical kernel code or
data have been corrupted. There are generally three causes for a corruption:
1) A driver has inadvertently or deliberately modified critical kernel code
 or data. See http://www.microsoft.com/whdc/driver/kernel/64bitPatching.mspx
2) A developer attempted to set a normal kernel breakpoint using a kernel
 debugger that was not attached when the system was booted. Normal breakpoints,
 "bp", can only be set if the debugger is attached at boot time. Hardware
 breakpoints, "ba", can be set at any time.
3) A hardware corruption occurred, e.g. failing RAM holding kernel code or data.
Arguments:
Arg1: a3a039d89d42e4f1, Reserved
Arg2: b3b7465eefc0b40f, Reserved
Arg3: fffff80002dcb510, Failure type dependent information
Arg4: 0000000000000000, Type of corrupted region, can be
 0 : A generic data region
 1 : Modification of a function or .pdata
 2 : A processor IDT
 3 : A processor GDT
 4 : Type 1 process list corruption
 5 : Type 2 process list corruption
 6 : Debug routine modification
 7 : Critical MSR modification

Debugging Details:
------------------


BUGCHECK_STR:  0x109

CUSTOMER_CRASH_COUNT:  1

DEFAULT_BUCKET_ID:  VISTA_DRIVER_FAULT

PROCESS_NAME:  System

CURRENT_IRQL:  0

LAST_CONTROL_TRANSFER:  from 0000000000000000 to fffff80002c89c40

STACK_TEXT:
... : nt!KeBugCheckEx


STACK_COMMAND:  kb

SYMBOL_NAME:  ANALYSIS_INCONCLUSIVE

FOLLOWUP_NAME:  MachineOwner

MODULE_NAME: Unknown_Module

IMAGE_NAME:  Unknown_Image

DEBUG_FLR_IMAGE_TIMESTAMP:  0

FAILURE_BUCKET_ID:  X64_0x109_ANALYSIS_INCONCLUSIVE

BUCKET_ID:  X64_0x109_ANALYSIS_INCONCLUSIVE

Followup: MachineOwner
---------
Further troubleshooting/fixes involve determining the nature of the problem (hardware v. software). If it is a hardware issue, troubleshooting falls along the lines of troubleshooting memory problems. If it is specifically due to a driver engaging in an unsupported practice, this driver should be updated to a current version or disabled.
0: kd> !analyze -v
*******************************************************************************
*                                                                             *
*                        Bugcheck Analysis                                    *
*                                                                             *
*******************************************************************************

CLOCK_WATCHDOG_TIMEOUT (101)
An expected clock interrupt was not received on a secondary processor in an
MP system within the allocated interval. This indicates that the specified
processor is hung and not processing interrupts.
Arguments:
Arg1: 0000000000000031, Clock interrupt time out interval in nominal clock ticks.
Arg2: 0000000000000000, 0.
Arg3: fffff88003164180, The PRCB address of the hung processor.
Arg4: 0000000000000002, 0.

Debugging Details:
------------------


BUGCHECK_STR:  CLOCK_WATCHDOG_TIMEOUT_4_PROC

CUSTOMER_CRASH_COUNT:  1

DEFAULT_BUCKET_ID:  VISTA_DRIVER_FAULT

PROCESS_NAME:  ccsvchst.exe

CURRENT_IRQL:  d

STACK_TEXT:
... : nt!KeBugCheckEx
... : nt! ?? ::FNODOBFM::`string'+0x4e2e
... : nt!KeUpdateSystemTime+0x377
... : hal!HalpHpetClockInterrupt+0x8d
... : nt!KiInterruptDispatchNoLock+0x163
... : nt!KeFlushMultipleRangeTb+0x260
... : nt!MiFlushTbAsNeeded+0x1d1
... : nt!MiAllocatePoolPages+0x4de
... : nt!ExpAllocateBigPool+0xb0
... : nt!ExAllocatePoolWithTag+0x82e
... : nt!ExAllocatePoolWithQuotaTag+0x56
... : nt!IopXxxControlFile+0xb1b
... : nt!NtDeviceIoControlFile+0x56
... : nt!KiSystemServiceCopyEnd+0x13
... : 0x73692e09


STACK_COMMAND:  kb

SYMBOL_NAME:  ANALYSIS_INCONCLUSIVE

FOLLOWUP_NAME:  MachineOwner

MODULE_NAME: Unknown_Module

IMAGE_NAME:  Unknown_Image

DEBUG_FLR_IMAGE_TIMESTAMP:  0

FAILURE_BUCKET_ID:  X64_CLOCK_WATCHDOG_TIMEOUT_4_PROC_ANALYSIS_INCONCLUSIVE

BUCKET_ID:  X64_CLOCK_WATCHDOG_TIMEOUT_4_PROC_ANALYSIS_INCONCLUSIVE

Followup: MachineOwner
---------

0: kd> !cpuinfo
CP  F/M/S Manufacturer  MHz PRCB Signature    MSR 8B Signature Features
 0 18,1,0 AuthenticAMD 1397 0000000000000000                   203b7dfe
0: kd> !prcb 0
PRCB for Processor 0 at fffff780ffff0000:
Current IRQL -- 13
Threads--  Current fffffa8009fa5aa0 Next fffffa8007960a10 Idle fffff80003217cc0
Processor Index 0 Number (0, 0) GroupSetMember 1
Interrupt Count -- 008b247c
Times -- Dpc    0000009d Interrupt 00000047
         Kernel 0007cb5a User      00005bbf
