Saturday, December 31, 2011

Troubleshooting 0xC0000221 STATUS_IMAGE_CHECKSUM_MISMATCH

The Debugging Tools for Windows are required to analyze crash dump files. If you do not have the Debugging Tools for Windows installed or dump files are not being generated on system crash, see this post for installation/configuration instructions:

http://mikemstech.blogspot.com/2011/11/windows-crash-dump-analysis.html

0xC0000221 is a somewhat uncommon blue screen error on the Windows platform (Windows XP, Windows Server 2003, Windows Vista, Windows Server 2008, Windows 7, Windows Server 2008 R2, and Windows 8). It is uncommon enough that it is not included in the standard list of bug check codes on MSDN and seems to crop up only when there is corruption in some of the critical system libraries. The actual bug code value is STATUS_IMAGE_CHECKSUM_MISMATCH:

C:\Users\Administrator>err c0000221
# for hex 0xc0000221 / decimal -1073741279 :
  STATUS_IMAGE_CHECKSUM_MISMATCH                         ntstatus.h
# {Bad Image Checksum}
# The image %hs is possibly corrupt. The header checksum does
# not match the computed checksum.
# 1 matches found for "c0000221" 
 
When I've observed this error, it usually is accompanied by a number of other errors that indicate file system corruption and possible memory issues (MEMORY_MANAGEMENT, NTFS_FILE_SYSTEM, SYSTEM_SERVICE_EXCEPTION [P1=0xc0000005], PAGE_FAULT_IN_NONPAGED_AREA, and SYSTEM_PTE_MISUES that only references the NT kernel). Since it isn't a common bug check that windbg knows how to handle, I had to take some educated guesses when I looked at the debugging output since there is no documentation for the parameters. I started out with a !analyze -v,
 
0: kd> !analyze -v
*******************************************************************************
*                                                                             *
*                        Bugcheck Analysis                                    *
*                                                                             *
*******************************************************************************

Unknown bugcheck code (c0000221)
Unknown bugcheck description
Arguments:
Arg1: fffff8a0002400e0
Arg2: 0000000000000000
Arg3: 0000000000000000
Arg4: 0000000000000000

Debugging Details:
------------------


BUGCHECK_STR:  0xc0000221

ERROR_CODE: (NTSTATUS) 0xc0000221 - {Bad Image Checksum} The image %hs is 
                                    possibly corrupt. The header checksum 
                                    does not match the computed checksum.

EXCEPTION_CODE: (NTSTATUS) 0xc0000221 - {Bad Image Checksum}  The image %hs is 
                                        possibly corrupt. The header checksum 
                                        does not match the computed checksum.

EXCEPTION_PARAMETER1:  fffff8a0002400e0

EXCEPTION_PARAMETER2:  0000000000000000

EXCEPTION_PARAMETER3:  0000000000000000

EXCEPTION_PARAMETER4: 0

MODULE_NAME: nt

IMAGE_NAME:  ntkrnlmp.exe

CUSTOMER_CRASH_COUNT:  1

DEFAULT_BUCKET_ID:  VISTA_DRIVER_FAULT

PROCESS_NAME:  System

CURRENT_IRQL:  0

LAST_CONTROL_TRANSFER:  from fffff800033112df to fffff800030c7c40

STACK_TEXT: 
... : nt!KeBugCheckEx
... : nt!ExpSystemErrorHandler2+0x5ff
... : nt!ExpSystemErrorHandler+0xdd
... : nt!ExpRaiseHardError+0xe1
... : nt!ExRaiseHardError+0x1d6
... : nt!NtRaiseHardError+0x1e4
... : nt!PspLocateSystemDll+0xbf
... : nt!PsLocateSystemDlls+0x69
... : nt!IoInitSystem+0x85d
... : nt!Phase1InitializationDiscard+0x129a
... : nt!Phase1Initialization+0x9
... : nt!PspSystemThreadStartup+0x5a
... : nt!KxStartSystemThread+0x16


STACK_COMMAND:  kb

FOLLOWUP_IP: 
nt!ExpSystemErrorHandler2+5ff
fffff800`033112df cc              int     3

SYMBOL_STACK_INDEX:  1

SYMBOL_NAME:  nt!ExpSystemErrorHandler2+5ff

FOLLOWUP_NAME:  MachineOwner

DEBUG_FLR_IMAGE_TIMESTAMP:  4e02aaa3

FAILURE_BUCKET_ID:  X64_0xc0000221_nt!ExpSystemErrorHandler2+5ff

BUCKET_ID:  X64_0xc0000221_nt!ExpSystemErrorHandler2+5ff

Followup: MachineOwner
---------
 
 
Then I took an educated guess with the first parameter. Sometimes these parameters point to plain text strings in memory that tell more about the error (this is similar to 0x000000F4 CRITICAL_OBJECT_TERMINATION). The Windows debuggers have a number of commands prefixed with the letter d that display sections of memory in various ways (ex. dt = display type, da= ASCII Characters, du=Unicode characters, etc). I got lucky on the first try by displaying the ASCII string located at parameter 1,

0: kd> da fffff8a0002400e0
fffff8a0`002400e0  "\SystemRoot\System32\ntdll.dll" 
 
In this case, the ntdll.dll file is corrupted. Since this is corruption with a critical system file, the file needs to be replaced in some way (backup, etc) and the file system needs to be repaired. A logical first step is to try a file system repair/verification and check the critical system files. Since the system is really unstable at this point, this should be performed in the offline mode. Additionally, this may be the result of various things including viruses, memory failures, and hard drive problems. It is a good idea to check the memory for errors, then check the hard drive, then perform a virus scan if the file is successfully repaired during system verification. If not, most of the Microsoft KBs identify that the system may need to be reinstalled. If the system is too unstable to successfully back up the files, they may need to be rescued using a Linux Live CD

See Also,
Windows Crash Dump Analysis
Troubleshooting Memory Errors
How To Detect a Failing Hard Drive
How to Perform an Offline System Integrity Verification

Troubleshooting 0xF4 CRITICAL_OBJECT_TERMINATION

The Debugging Tools for Windows are required to analyze crash dump files. If you do not have the Debugging Tools for Windows installed or dump files are not being generated on system crash, see this post for installation/configuration instructions:

http://mikemstech.blogspot.com/2011/11/windows-crash-dump-analysis.html

0x000000F4 CRITICAL_OBJECT_TERMINATION is a common blue screen error on the Windows platform (Windows XP, Windows Server 2003, Windows Vista, Windows Server 2008, Windows 7, Windows Server 2008 R2, and Windows 8). This error occurs when a critical system process or thread is terminated. The termination is detected and results in a bug check that dumps information on the state of the system when the thread or process is killed. Critical system processes include
  • smss.exe - Session Management Subsystem
  • csrss.exe - Client/Server Runtime Subsystem
  • wininit.exe - Session 0 initialization
  • logonui.exe - Windows logon process
  • lsass.exe - Local Security Authority Subsystem
  • services.exe - Service Control Manager
  • services.exe processes hosting RPC Endpoint Mapper (RPCSS), DCOM Server Process Launcher, and Plug and Play services
To illustrate the mechanics of debugging, I created two crashes, one that shows a critical thread termination and one that shows a critical process termination. The debugging process is fairly straightforward and an example is given for each below. The main difference is identified by parameter 1.

Case 1: Critical Process Termination (Parameter 1 = 3) 

A starting point for debugging a critical process termination dump is to use the !analyze -v debugger command,


kd> !analyze -v
*******************************************************************************
*                                                                             *
*                        Bugcheck Analysis                                    *
*                                                                             *
*******************************************************************************

CRITICAL_OBJECT_TERMINATION (f4)
A process or thread crucial to system operation has unexpectedly exited or been
terminated.
Several processes and threads are necessary for the operation of the
system; when they are terminated (for any reason), the system can no
longer function.
Arguments:
Arg1: 0000000000000003, Process
Arg2: fffffa80022fd060, Terminating object
Arg3: fffffa80022fd340, Process image file name
Arg4: fffff800017d2240, Explanatory message (ascii)

Debugging Details:
------------------


PROCESS_OBJECT: fffffa80022fd060

IMAGE_NAME:  _

DEBUG_FLR_IMAGE_TIMESTAMP:  0

MODULE_NAME: _

FAULTING_MODULE: 0000000000000000 

PROCESS_NAME:  procexp64.exe

BUGCHECK_STR:  0xF4_procexp64.exe

CUSTOMER_CRASH_COUNT:  1

DEFAULT_BUCKET_ID:  DRIVER_FAULT_SERVER_MINIDUMP

CURRENT_IRQL:  0

LAST_CONTROL_TRANSFER:  from fffff80001855142 to fffff800014c9f00

STACK_TEXT:  
... : nt!KeBugCheckEx
... : nt!PspCatchCriticalBreak+0x92
... : nt! ?? ::NNGAKEGL::`string'+0x17a06
... : nt!NtTerminateProcess+0xf4
... : nt!KiSystemServiceCopyEnd+0x13
... : 0x7707017a
... : nt!KiCallUserMode


STACK_COMMAND:  kb

FOLLOWUP_NAME:  MachineOwner

FAILURE_BUCKET_ID:  X64_0xF4_procexp64.exe_IMAGE__

BUCKET_ID:  X64_0xF4_procexp64.exe_IMAGE__

Followup: MachineOwner
---------
 
 
The PROCESS_NAME string should hopefully identify a process that caused the exit. Parameter 2 contains the address for the process object that terminated. This can be viewed using the !process debugger command. The Image lne indicates the name of the process (in this example, this was csrss.exe).

kd> !process fffffa80022fd060
GetPointerFromAddress: unable to read from fffff80001700000
PROCESS fffffa80022fd060
    SessionId: none  Cid: 01b0    Peb: 7fffffd5000  ParentCid: 01a8
    DirBase: 7a7ea000  ObjectTable: fffff8a0010d3a50 
                       HandleCount: 
    Image: csrss.exe
    VadRoot fffffa80023326f0 Vads 75 Clone 0 Private 300. Modified 209. Locked 0.
    DeviceMap fffff8a000008b30
    Token                             fffff8a0010da970
    ReadMemory error: Cannot get nt!KeMaximumIncrement value.
fffff78000000000: Unable to get shared data
    ElapsedTime                       00:00:00.000
    UserTime                          00:00:00.000
    KernelTime                        00:00:00.000
    QuotaPoolUsage[PagedPool]         0
    QuotaPoolUsage[NonPagedPool]      0
    Working Set Sizes (now,min,max)  (1242, 50, 345) (4968KB, 200KB, 1380KB)
    PeakWorkingSetSize                1244
    VirtualSize                       42 Mb
    PeakVirtualSize                   42 Mb
    PageFaultCount                    1596
    MemoryPriority                    BACKGROUND
    BasePriority                      13
    CommitCharge                      439

        *** Error in reading nt!_ETHREAD @ fffffa800231e060
 
 
Parameter 3 contains the process image file name, usually in ASCII format. Use the display memory command to display an ASCII string (da) or a Unicode string (du).

kd> da fffffa80022fd340
fffffa80`022fd340  "csrss.exe" 
 
Parameter 4 contains a pointer to an explanatory message written in ascii, display with the da debugger command
 
kd> da fffff800017d2240
fffff800`017d2240  "Terminating critical process 0x%"
fffff800`017d2260  "p (%s)."  

Case 2: Critical Thread Termination (Parameter 1 = 6)

A starting point for debugging a critical thread termination dump is to use the !analyze -v debugger command,


kd> !analyze -v
*******************************************************************************
*                                                                             *
*                        Bugcheck Analysis                                    *
*                                                                             *
*******************************************************************************

CRITICAL_OBJECT_TERMINATION (f4)
A process or thread crucial to system operation has unexpectedly exited or been
terminated.
Several processes and threads are necessary for the operation of the
system; when they are terminated (for any reason), the system can no
longer function.
Arguments:
Arg1: 0000000000000006, Thread
Arg2: fffffa8001d4e900, Terminating object
Arg3: fffffa8001d65e10, Process image file name
Arg4: fffff8000178c210, Explanatory message (ascii)

Debugging Details:
------------------


CUSTOMER_CRASH_COUNT:  1

DEFAULT_BUCKET_ID:  DRIVER_FAULT_SERVER_MINIDUMP

BUGCHECK_STR:  0xF4

PROCESS_NAME:  procexp64.exe

CURRENT_IRQL:  0

LAST_CONTROL_TRANSFER:  from fffff8000180f142 to fffff80001483f00

STACK_TEXT:  
... : nt!KeBugCheckEx
... : nt!PspCatchCriticalBreak+0x92
... : nt! ?? ::NNGAKEGL::`string'+0x29a68
... : nt! ?? ::NNGAKEGL::`string'+0x3f47d
... : nt!KiSystemServiceCopyEnd+0x13
... : 0x776503ea


STACK_COMMAND:  kb

FOLLOWUP_IP: 
nt!PspCatchCriticalBreak+92
fffff800`0180f142 cc              int     3

SYMBOL_STACK_INDEX:  1

SYMBOL_NAME:  nt!PspCatchCriticalBreak+92

FOLLOWUP_NAME:  MachineOwner

MODULE_NAME: nt

IMAGE_NAME:  ntkrnlmp.exe

DEBUG_FLR_IMAGE_TIMESTAMP:  4a5bc600

FAILURE_BUCKET_ID:  X64_0xF4_nt!PspCatchCriticalBreak+92

BUCKET_ID:  X64_0xF4_nt!PspCatchCriticalBreak+92

Followup: MachineOwner
---------
 
The PROCESS_NAME string should hopefully identify a process that caused the exit. Parameter 2 contains the address for the thread object that terminated. This can be viewed using the !thread debugger command. The Owning Process line indicates the name of the process (in this example, this was smss.exe).

kd> !thread fffffa8001d4e900
GetPointerFromAddress: unable to read from fffff800016ba000
THREAD fffffa8001d4e900  Cid 0130.0134  Teb: 000007fffffdd000 
    Win32Thread: 0000000000000000 WAIT: (UserRequest) UserMode Non-Alertable
    fffffa8001e0d730  NotificationEvent
Not impersonating
GetUlongFromAddress: unable to read from fffff800015f8b74
Owning Process            fffffa8001d65b30       Image:         smss.exe
Attached Process          N/A            Image:         N/A
fffff78000000000: Unable to get shared data
Wait Start TickCount      692          
Context Switch Count      479             
ReadMemory error: Cannot get nt!KeMaximumIncrement value.
UserTime                  00:00:00.000
KernelTime                00:00:00.000
Win32 Start Address 0x0000000048347d9c
Stack Init fffff88002222db0 Current fffff88002221fd0
Base fffff88002223000 Limit fffff8800221d000 Call 0
Priority 12 BasePriority 11 UnusualBoost 0 ForegroundBoost 0 IoPriority 2 
PagePriority 5
Kernel stack not resident.
 
 
Parameter 3 contains the process image file name, usually in ASCII format. Use the display memory command to display an ASCII string (da) or a Unicode string (du).

kd> da fffffa8001d65e10
fffffa80`01d65e10  "smss.exe" 
 
Parameter 4 contains a pointer to an explanatory message written in ascii, display with the da debugger command
 
kd> da fffff8000178c210
fffff800`0178c210  "Terminating critical thread 0x%p"
fffff800`0178c230  " (in %s)." 
 

Further Troubleshooting

Further troubleshooting and potential fixes involve identifying the cause of the termination, this can be anything from a virus to a corrupted image or a problem with the registry. An error in a custom credential provider (Vista and later) or Graphical Identification and Authentication (GINA) DLL (pre-Vista) could also cause this error.

Things to try if the system is unbootable/unusable due to this error,

  • Perform an offline system integrity check
  • Roll back any recent changes (applications, patches, etc) in safe mode
  • Perform a clean boot of the system
  • Run startup repair
  • Examine the registry offline and compare key parts of the registry related to the critical processes and services to a working system
  • If you have a custom provider or GINA extension (most user's don't), remotely debug the system and notify the developers of the issue. Temporarily disable the custom provider or GINA DLL through the offline registry edit process mentioned above.
In the end, it may not be possible to recover the system from this error and the system may need to have Windows reinstalled. To perform a clean install, files from the existing system may need to be saved.

See Also,

Windows Crash Dump Analysis

How to Edit the Registry of an Offline Windows System

From time to time it is necessary to edit the registry for a Windows system that is not currently online. This can be accomplished from the recovery console using the following procedure. Note that you should know exactly what you are doing before you attempt to make any changes to the registry, regardless of whether it is for an online or offline system. Ensure that adequate system backups area available and make note of any changes in the event that they need to be reversed.

Boot off of the Windows installation media


Select Repair your computer,


Select the OS to mount for the recovery tools, this post demonstrates using Windows Server 2008 R2, but this should work for Windows Vista, Windows Server 2008, Windows 7, and Windows 8.


Open a command prompt,


Launch regedit and click on the hive to modify, then click file -> Load Hive,


Navigate to the \Windows\system32\config directory of the system partition for the installation to modify and open the correct hive,

DEFAULT -> HKEY_USERS
SAM -> HKEY_LOCAL_MACHINE\SAM
SECURITY -> HKEY_LOCAL_MACHINE\Security
SOFTWARE -> HKEY_LOCAL_MACHINE\Software
SYSTEM -> HKEY_LOCAL_MACHINE\System

The ntuser.dat file in the user's profile directory holds the registry data loaded under HKEY_USERS\<sid> (HKEY_CURRENT_USER for the logged on user).

Select a name that makes sense, I use something like HKEY_RESCUED_SYSTEM,


The hive is now loaded and can be viewed/modified as needed,


HKEY_RESCUED_SYSTEM holds the HKEY_LOCAL_SYSTEM\System hive for the Windows installation that we are trying to work with.


See Also,
Windows Crash Dump Analysis
How to Perform an Offline System Integrity Verification
How To Rescue Files From a Damaged System


Tuesday, December 27, 2011

Troubleshooting 0x7F UNEXPECTED_KERNEL_MODE_TRAP

The Debugging Tools for Windows are required to analyze crash dump files. If you do not have the Debugging Tools for Windows installed or dump files are not being generated on system crash, see this post for installation/configuration instructions:

http://mikemstech.blogspot.com/2011/11/windows-crash-dump-analysis.html

0x0000007F UNEXPECTED_KERNEL_MODE_TRAP (also identified as 0x1000007F UNEXPECTED_KERNEL_MODE_TRAP_M) is a very common blue screen of death on the Windows platform (Windows XP, Windows Server 2003, Windows Vista, Windows Server 2008, Windows 7, Windows Server 2008 R2, and Windows 8). This error is generally limited to Intel CPUs and is thrown when the CPU generates a trap that the kernel does not catch. This is typically due to a bound trap (one that the kernel can;t catch) or a double fault (an error occurs in error handling code). The error codes that sometimes end up in parameter 1 are listed here, these are listed/adapted from MSDN:

0x00000000 Divide by zero error
0x00000001 "A system-debugger call"
0x00000003 A debugger breakpoint. If this makes it into production code, this is a sloppy practice, see this post for a similar example.
0x00000004 "Overflow, occurs when the processor executes a call to an interrupt handler when the overflow (OF) flag is set. "This indicates that an integer operation overflowed and an error handling routine is called. This is likely seen when the processor is configured to automatically generate an exception when an overflow occurs.
0x00000005 Bounds Check Fault, indicates that the processor, while executing a BOUND instruction, finds that the operand exceeds the specified limits. A BOUND instruction ensures that a signed array index is within a certain range."
0x00000006 "Invalid Opcode, indicates that the processor tries to execute an invalid instruction. This error typically occurs when the instruction pointer has become corrupted and is pointing to the wrong location. The most common cause of this error is hardware memory corruption." Investigate as a potential hardware issue.
0x00000007 "A hardware coprocessor instruction with no coprocessor present."
0x00000008 Double fault. This is the most common exception subcode. This either occurs when a driver recurses too far and overflows a stack or memory corruption occurs. In the latter case, start with a memory test and enable driver verifier. In the former case, test different driver versions to see if one eliminates the fault, otherwise enable driver verifier to see if something is corrupting the memory.
0x0000000A "A corrupted Task State Segment"
0x0000000B "An access to a memory segment that was not present."
0x0000000C "An access to memory beyond the limits of a stack"
0x0000000D "An exception not covered by some other exception; a protection fault that pertains to access violations for applications"

Generic troubleshooting involves identifying issues with the memory and changing the driver version of the driver identified in the minidump. Aslo assure that other drivers and the system BIOS are up to date. Further information might be gained from the driver verifier or by analyzing a kernel memory dump, full memory dump, or using a live debugging session (and analyzing the stack based on the trap frames, task gate, or task state segment present; this is not useful with a minidump). Here is an example of a double fault blamed on an Intel graphics card driver (this is also common with AMD/ATI and NVidia cards, as well as Antivirus/Firewall vendors),


0: kd> !analyze -v
*******************************************************************************
*                                                                             *
*                        Bugcheck Analysis                                    *
*                                                                             *
*******************************************************************************

UNEXPECTED_KERNEL_MODE_TRAP (7f)
This means a trap occurred in kernel mode, and it's a trap of a kind
that the kernel isn't allowed to have/catch (bound trap) or that
is always instant death (double fault).  The first number in the
bugcheck params is the number of the trap (8 = double fault, etc)
Consult an Intel x86 family manual to learn more about what these
traps are. Here is a *portion* of those codes:
If kv shows a taskGate
        use .tss on the part before the colon, then kv.
Else if kv shows a trapframe
        use .trap on that value
Else
        .trap on the appropriate frame will show where the trap was taken
        (on x86, this will be the ebp that goes with the procedure KiTrap)
Endif
kb will then show the corrected stack.
Arguments:
Arg1: 0000000000000008, EXCEPTION_DOUBLE_FAULT
Arg2: 0000000080050033
Arg3: 00000000000406f8
Arg4: fffff88005be31b4

Debugging Details:
------------------


BUGCHECK_STR:  0x7f_8

CUSTOMER_CRASH_COUNT:  1

DEFAULT_BUCKET_ID:  VISTA_DRIVER_FAULT

PROCESS_NAME:  System

CURRENT_IRQL:  7

LAST_CONTROL_TRANSFER:  from fffff80002ce52a9 to fffff80002ce5d00

STACK_TEXT:  
... : nt!KeBugCheckEx
... : nt!KiBugCheckDispatch+0x69
... : nt!KiDoubleFaultAbort+0xb2
... : igdpmd64+0x1911b4
... : 0x7109d704`2315c235
... : 0x899e2543`a1daf8d0
... : 0xfffffa80`07333010


STACK_COMMAND:  kb

FOLLOWUP_IP: 
igdpmd64+1911b4
fffff880`05be31b4 e8e7ffffff      call    igdpmd64+0x1911a0 (fffff880`05be31a0)

SYMBOL_STACK_INDEX:  3

SYMBOL_NAME:  igdpmd64+1911b4

FOLLOWUP_NAME:  MachineOwner

MODULE_NAME: igdpmd64

IMAGE_NAME:  igdpmd64.sys

DEBUG_FLR_IMAGE_TIMESTAMP:  4df25f60

FAILURE_BUCKET_ID:  X64_0x7f_8_igdpmd64+1911b4

BUCKET_ID:  X64_0x7f_8_igdpmd64+1911b4

Followup: MachineOwner
---------

0: kd> lmvm igdpmd64
start             end                 module name
fffff880`05a52000 fffff880`065fc100   igdpmd64 T (no symbols)           
    Loaded symbol image file: igdpmd64.sys
    Image path: \SystemRoot\system32\DRIVERS\igdpmd64.sys
    Image name: igdpmd64.sys
    Timestamp:        Fri Jun 10 12:16:00 2011 (4DF25F60)
    CheckSum:         00BB2563
    ImageSize:        00BAA100
    Translations:     0000.04b0 0000.04e4 0409.04b0 0409.04e4
 
 
See Also,
Windows Crash Dump Analysis
Troubleshooting Memory Errors
How to Perform an Offline System Integrity Verification
Enable Driver Verifier to Help Identify Blue Screen Causes


Troubleshooting 0x48 CANCEL_STATE_IN_COMPLETED_IRP

The Debugging Tools for Windows are required to analyze crash dump files. If you do not have the Debugging Tools for Windows installed or dump files are not being generated on system crash, see this post for installation/configuration instructions:
http://mikemstech.blogspot.com/2011/11/windows-crash-dump-analysis.html

0x00000048 CANCEL_STATE_IN_COMPLETED_IRP is a fairly uncommon blue screen of death on the Windows platform (Windows XP, Windows Server 2003, Windows Vista, Windows Server 2008, Windows 7, Windows Server 2008 R2, and Windows 8). This bug indicates that the cancel routine was called for an IRP after it was already completed. This is analogous to attempting to stop payment on a check after it has been cashed/deposited and processed... At this point, there is nothing to cancel because the money has already entered/left the bank (depending on the perspective). 

The documentation for the Windows Driver Kit states that this is often caused by more than one driver accessing/processing the same packet, rather than a single buggy driver. An example might be two drivers that believe that they "own" an IRP, one completes the IRP with a call to  IoCompleteRequest and the other driver calls IoCancelIrp on the packet. If both drivers had called IoCompleteRequest, the bug check MULTIPLE_IRP_COMPLETE_REQUESTS would have been thrown. The example with a single buggy driver might occur if a programmer mistakenly creates a IoCancelIrp call after the IoCompleteRequest call in a path of execution.

Debugging a minidump with this stop error isn't always the most informative. I have only come across one example,

 
0: kd> !analyze -v
*******************************************************************************
*                                                                             *
*                        Bugcheck Analysis                                    *
*                                                                             *
*******************************************************************************

CANCEL_STATE_IN_COMPLETED_IRP (48)
This bugcheck indicates that an I/O Request Packet (IRP) that is to be
cancelled, has a cancel routine specified in it -- meaning that the packet
is in a state in which the packet can be cancelled -- however, the packet
no longer belongs to a driver, as it has entered I/O completion.  This is
either a driver bug, or more than one driver is accessing the same packet,
which is not likely and much more difficult to find. The cancel routine
parameter will provide a clue as to which driver or stack is the culprit.
Arguments:
Arg1: 950fc008, Pointer to the IRP
Arg2: 8fb66ff1, Cancel routine set by the driver.
Arg3: 00000000
Arg4: 00000000

Debugging Details:
------------------


CUSTOMER_CRASH_COUNT:  1

DEFAULT_BUCKET_ID:  DRIVER_FAULT_SERVER_MINIDUMP

BUGCHECK_STR:  0x48

PROCESS_NAME:  w3wp.exe

CURRENT_IRQL:  2

LAST_CONTROL_TRANSFER:  from 81c82297 to 81c6e72f

STACK_TEXT:  
8f5d1be4 81c82297 950fc008 95027dd8 00000000 nt!IoCancelIrp+0x73
8f5d1c18 81e38234 8800a168 88ffad90 00000000 nt!IopCancelIrpsInFileObjectList+0xb3
8f5d1c74 81e3310a 88ffad90 8800a168 00100081 nt!IopCloseFile+0x409
8f5d1cc4 81e32f9a 88ffad90 0041ed40 00100081 nt!ObpDecrementHandleCount+0x146
8f5d1d14 81e32cad 9e33fa70 9bc6d500 88ffad90 nt!ObpCloseHandleTableEntry+0x234
8f5d1d44 81e33530 88ffad90 a7a89901 a7a89901 nt!ObpCloseHandle+0x73
8f5d1d58 81c9997a 00000280 0019f9cc 76f79a94 nt!NtClose+0x20
8f5d1d58 76f79a94 00000280 0019f9cc 76f79a94 nt!KiFastCallEntry+0x12a
WARNING: Frame IP not in any known module. Following frames may be wrong.
0019f9cc 00000000 00000000 00000000 00000000 0x76f79a94


STACK_COMMAND:  kb

FOLLOWUP_IP: 
nt!IoCancelIrp+73
81c6e72f 8a442414        mov     al,byte ptr [esp+14h]

SYMBOL_STACK_INDEX:  0

SYMBOL_NAME:  nt!IoCancelIrp+73

FOLLOWUP_NAME:  MachineOwner

MODULE_NAME: nt

IMAGE_NAME:  ntkrnlmp.exe

DEBUG_FLR_IMAGE_TIMESTAMP:  48d1b7e8

FAILURE_BUCKET_ID:  0x48_nt!IoCancelIrp+73

BUCKET_ID:  0x48_nt!IoCancelIrp+73

Followup: MachineOwner
--------- 
  
In this particular example, the IRP is not dumped,

0: kd> !irp 950fc008
950fc008: Could not read Irp 
 
Using the ln (list nearest symbol debugger command) on the cancel routine address indicates the driver that set the cancel routine.
 
0: kd> ln 8fb66ff1
(8fb66ff1)   rdbss!RxCancelRoutine   |  (8fb670b6)   rdbss!WPP_SF_qZLL 
 
In this case, the "Redirected Drive Buffering SubSystem Driver" registered the cancel routine. Advanced troubleshooting of this issue requires the use of a kernel dump or remote debugger to identify the relevant drivers involved in the device stack (based on the information gathered from the !irp output in the kernel memory dump or from the live remote debugging session). See the !devstack command in the debugger help for more information. Try updating the involved drivers or contacting the vendor(s) for support.

See Also,
Windows Crash Dump Analysis


Monday, December 26, 2011

Free Windows 7?

I see this post on the forums so often that it seems prudent to answer it with a post. There is no such thing as a "free" Windows 7 or any other installation of Windows (Windows XP, Windows Server 2003, Windows Vista, Windows Server 2008, Windows 7, Windows Server 2008 R2). There is also no legal way to freely obtain a Windows activation key (except for special cases when they are provided directly from Microsoft). Windows 7 is licensed by Microsoft to companies and end users for a fee, but there may be a way to get a version of Windows 7 that is no cost to you. Here are a few ideas of sources,

For Employees

Some organizations purchase a volume license for Windows that allows them to install and activate an unlimited number of installations of Windows. The enterprise agreement and organizational policy may state that employees can use the Windows installation for a home computer (or a computer at home used for work purposes). To find out if this is possible, ask your IT department.

For Students

Some schools purchase a volume license for Windows that allows them to install and activate an unlimited number of installations of Windows. The enterprise agreement and organizational policy may allow them to install or upgrade to Windows 7 on your personal computer that is used for class work.

An alternative to using the desktop operating system is to use Windows Server 2008 R2, but convert the installation to include many of the desktop features such as Aero. Windows Server 2008 R2 is freely available to students from Microsoft Dreamspark.

For Business Owners

Although this isn't free, it may be possible to license Windows 7 for your organization and take a tax deduction on your business' tax return. Seek the advice of an accountant that is familiar with your country's tax laws and practices to see if this is a possibility.

Other Methods

Unless Microsoft offers another program to provide Windows for free, the only other methods to successfully activate Windows without buying it are illegal. Most of these involve installing a crack or cracked version of Windows or disabling the Activation component in Windows. These types of activities are not recommended because it is possible for cracks/cracked versions to contain viruses and other malware. Additionally, some of the changes that may be required could render the system unstable and unusable. Microsoft periodically releases updates that undo most of the cracks that are available, so the illegal version may stop functioning after an update is released. It may also be possible to find keys online through warez sites and other parts of the Internet's underground, but Microsoft periodically invalidates installations that use these keys. Besides the technical difficulties presented, it is also possible to be prosecuted under criminal law and to be sued by Microsoft in a civil trial in the event that you are caught. The moral of the story... If you need Windows, buy it!

Alternatives

If you need a permanent operating system, consider a freely available operating system such as Linux. Some applications can successfully run under an emulation layer such as wine (Windows emulation). Other applications have direct ports to Linux or can be recompiled to run under Linux. Some open source alternatives also exist for commonly used Microsoft software/formats. One example of this is OpenOffice (compare with Microsoft Office).

If you need to run Windows temporarily, get the trial version as it will allow a number of days of testing before it requires activation (I believe that 60 is the current number...).

Troubleshooting 0x1E KMODE_EXCEPTION_NOT_HANDLED

The Debugging Tools for Windows are required to analyze crash dump files. If you do not have the Debugging Tools for Windows installed or dump files are not being generated on system crash, see this post for installation/configuration instructions:
http://mikemstech.blogspot.com/2011/11/windows-crash-dump-analysis.html

0x1000001E KMODE_EXCEPTION_NOT_HANDLED is a common bug check (BSOD) that occurs on Windows systems (Windows XP, Windows Server 2003, Windows Vista, Windows Server 2008, Windows 7, Windows Server 2008 R2, and Windows 8). Similar to 0x8E KERNEL_MODE_EXCEPTION_NOT_HANDLED, this error indicates that an error occurred in privileged mode (kernel mode) without any associated code to handle the error. Like 8E, there are a couple of variations, some that are due to other drivers (caused by memory corruption, often with a sub-status of 0xc0000005 STATUS_ACCESS_VIOLATION), and those that are due to the drivers in which they are detected.

Troubleshooting these bug checks are fairly straightforward, starting with a !analyze -v. If there is no memory corruption and a driver is identified, alternate versions of the identified driver should be tested, along with upgraded/downgraded BIOS versions. The same approach should be taken with memory corruption issues, but in addition, hardware problems should be ruled out and the driver verifier should be enabled to see if more informative dumps can be generated (specifically implicating a driver that is reading or writing invalid memory).

Below are a few debugging examples for this blue screen of death,

Example 1: Sloppy Programming/Development Practices

During the development processes, programmers insert breakpoints into specific sections of code so that they can use a debugger to see what the driver/application state is at a specific point of execution. Before an application/driver is released, the breakpoints should be removed, otherwise they will generate an exception. In kernel mode, this crashes the system. In user mode, this simply crashes the application (unless a debugger is attached and the command is given to continue past the breakpoint). Allowing a breakpoint to be shipped into production code is a sloppy practice that is the result of a poorly controlled and audited development process.

In this dump, the silabser.sys driver is implicated and the exception is clearly due to a breakpoint in the code that shipped with the final release.

5: kd> !analyze -v
*******************************************************************************
*                                                                             *
*                        Bugcheck Analysis                                    *
*                                                                             *
*******************************************************************************

KMODE_EXCEPTION_NOT_HANDLED (1e)
This is a very common bugcheck.  Usually the exception address pinpoints
the driver/function that caused the problem.  Always note this address
as well as the link date of the driver/image that contains this address.
Arguments:
Arg1: 0000000000000000, The exception code that was not handled
Arg2: 0000000000000000, The address that the exception occurred at
Arg3: 0000000000000000, Parameter 0 of the exception
Arg4: 0000000000000000, Parameter 1 of the exception

Debugging Details:
------------------


EXCEPTION_CODE: (Win32) 0 (0) - The operation completed successfully.

FAULTING_IP: 
+3132323761623761
00000000`00000000 ??              ???

EXCEPTION_PARAMETER1:  0000000000000000

EXCEPTION_PARAMETER2:  0000000000000000

ERROR_CODE: (NTSTATUS) 0 - STATUS_WAIT_0

BUGCHECK_STR:  0x1E_0

CUSTOMER_CRASH_COUNT:  1

DEFAULT_BUCKET_ID:  VISTA_DRIVER_FAULT

PROCESS_NAME:  System

CURRENT_IRQL:  2

EXCEPTION_RECORD:  fffff880030b08a8 -- (.exr 0xfffff880030b08a8)
ExceptionAddress: fffff800030d4a70 (nt!DbgBreakPoint)
   ExceptionCode: 80000003 (Break instruction exception)
  ExceptionFlags: 00000000
NumberParameters: 1
   Parameter[0]: 0000000000000000

TRAP_FRAME:  fffff880030b0950 -- (.trap 0xfffff880030b0950)
NOTE: The trap frame does not contain all registers.
Some register values may be zeroed or incorrect.
rax=0000000000000000 rbx=0000000000000000 rcx=fffff88000f60f70
rdx=fffffa8007ad26b0 rsi=0000000000000000 rdi=0000000000000000
rip=fffff800030d4a71 rsp=fffff880030b0ae8 rbp=0000000000000000
 r8=fffffa8007ad26b0  r9=fffff88000f60f40 r10=7efefeff71647261
r11=fffff880030b0ad0 r12=0000000000000000 r13=0000000000000000
r14=0000000000000000 r15=0000000000000000
iopl=0         nv up ei pl nz na pe nc
nt!DbgBreakPoint+0x1:
fffff800`030d4a71 c3              ret
Resetting default scope

LAST_CONTROL_TRANSFER:  from fffff800030d45fe to fffff800030dcc10

STACK_TEXT:  
... : nt!KeBugCheck
... : nt!KiKernelCalloutExceptionHandler+0xe
... : nt!RtlpExecuteHandlerForException+0xd
... : nt!RtlDispatchException+0x415
... : nt!KiDispatchException+0x135
... : nt!KiExceptionDispatch+0xc2
... : nt!KiBreakpointTrap+0xf4
... : nt!DbgBreakPoint+0x1
... : Wdf01000!FxRequest::VerifierVerifyRequestIsCancelable+0x80
... : Wdf01000!FxIoQueue::RequestCancelable+0xe7
... : Wdf01000!imp_WdfRequestUnmarkCancelable+0xbc
... : silabser+0x7319
... : 0xfffffa80`0878b880
... : 0xfffffa80`0878ba10
... : 0x57f`f7874778
... : 0x1
... : 0xfffffa80`07038d28
... : 0xc0000120
... : silabser+0x804e
... : 0xfffffa80`0878ba10


STACK_COMMAND:  kb

FOLLOWUP_IP: 
silabser+7319
fffff880`04dbf319 ??              ???

SYMBOL_STACK_INDEX:  b

SYMBOL_NAME:  silabser+7319

FOLLOWUP_NAME:  MachineOwner

MODULE_NAME: silabser

IMAGE_NAME:  silabser.sys

DEBUG_FLR_IMAGE_TIMESTAMP:  4e83514f

FAILURE_BUCKET_ID:  X64_0x1E_0_silabser+7319

BUCKET_ID:  X64_0x1E_0_silabser+7319

Followup: MachineOwner
--------- 
 

Example 2: Memory Corruption

This is a particularly interesting case of memory corruption because the symbols and state that was dumped was corrupted enough to make the symbols unrecognizable from a debugger perspective. Even though we can obviously tell that the problem was detected in the NT kernel, the debugger has difficulty analyzing the dump and complains (incorrectly) about missing symbols.


kd> !analyze -v
*******************************************************************************
*                                                                             *
*                        Bugcheck Analysis                                    *
*                                                                             *
*******************************************************************************

KMODE_EXCEPTION_NOT_HANDLED (1e)
This is a very common bugcheck.  Usually the exception address pinpoints
the driver/function that caused the problem.  Always note this address
as well as the link date of the driver/image that contains this address.
Arguments:
Arg1: ffffffffc0000005, The exception code that was not handled
Arg2: fffff80002e7c1d1, The address that the exception occurred at
Arg3: 0000000000000000, Parameter 0 of the exception
Arg4: ffffffffffffffff, Parameter 1 of the exception

Debugging Details:
------------------

***** Kernel symbols are WRONG. Please fix symbols to do analysis.

*************************************************************************
***                                                                   ***
***                                                                   ***
***    Your debugger is not using the correct symbols                 ***
***                                                                   ***
***    In order for this command to work properly, your symbol path   ***
***    must point to .pdb files that have full type information.      ***
***                                                                   ***
***    Certain .pdb files (such as the public OS symbols) do not      ***
***    contain the required information.  Contact the group that      ***
***    provided you with these symbols if you need this command to    ***
***    work.                                                          ***
***                                                                   ***
***    Type referenced: nt!_KPRCB                                     ***
***                                                                   ***
*************************************************************************
*************************************************************************
***                                                                   ***
***                                                                   ***
***    Your debugger is not using the correct symbols                 ***
***                                                                   ***
***    In order for this command to work properly, your symbol path   ***
***    must point to .pdb files that have full type information.      ***
***                                                                   ***
***    Certain .pdb files (such as the public OS symbols) do not      ***
***    contain the required information.  Contact the group that      ***
***    provided you with these symbols if you need this command to    ***
***    work.                                                          ***
***                                                                   ***
***    Type referenced: nt!_KPRCB                                     ***
***                                                                   ***
*************************************************************************

ADDITIONAL_DEBUG_TEXT:  
Use '!findthebuild' command to search for the target build information.
If the build information is available, run '!findthebuild -s ; .reload' 
to set symbol path and load symbols.

MODULE_NAME: nt

FAULTING_MODULE: fffff80002e0c000 nt

DEBUG_FLR_IMAGE_TIMESTAMP:  4a5bc600

EXCEPTION_CODE: (NTSTATUS) 0xc0000005 - 
     The instruction at 0x%08lx referenced memory at 0x%08lx. 
     The memory could not be %s.

FAULTING_IP: 
nt+701d1
fffff800`02e7c1d1 0fae55ac        ldmxcsr dword ptr [rbp-54h]

EXCEPTION_PARAMETER1:  0000000000000000

EXCEPTION_PARAMETER2:  ffffffffffffffff

READ_ADDRESS: unable to get nt!MmSpecialPoolStart
unable to get nt!MmSpecialPoolEnd
unable to get nt!MmPoolCodeStart
unable to get nt!MmPoolCodeEnd
 ffffffffffffffff 

ERROR_CODE: (NTSTATUS) 0xc0000005 - The instruction at 0x%08lx referenced 
                            memory at 0x%08lx. The memory could not be %s.

BUGCHECK_STR:  0x1E_c0000005

CUSTOMER_CRASH_COUNT:  1

DEFAULT_BUCKET_ID:  VISTA_DRIVER_FAULT

CURRENT_IRQL:  0

LAST_CONTROL_TRANSFER:  from fffff80002ebda17 to fffff80002e7df00

STACK_TEXT:  
... : nt+0x71f00
... : nt+0xb1a17
... : 0x1e
... : 0xffffffff`c0000005
... : nt+0x701d1


STACK_COMMAND:  kb

FOLLOWUP_IP: 
nt+701d1
fffff800`02e7c1d1 0fae55ac        ldmxcsr dword ptr [rbp-54h]

SYMBOL_STACK_INDEX:  4

SYMBOL_NAME:  nt+701d1

FOLLOWUP_NAME:  MachineOwner

IMAGE_NAME:  ntoskrnU.exe

BUCKET_ID:  WRONG_SYMBOLS

Followup: MachineOwner
--------- 
 
See Also,
Windows Crash Dump Analysis
Troubleshooting Memory Errors

Monday, December 19, 2011

Troubleshooting 0x1a MEMORY_MANAGEMENT

The Debugging Tools for Windows are required to analyze crash dump files. If you do not have the Debugging Tools for Windows installed or dump files are not being generated on system crash, see this post for installation/configuration instructions:
http://mikemstech.blogspot.com/2011/11/windows-crash-dump-analysis.html

0x0000001A MEMORY_MANAGEMENT is a blue screen of death that occurs when the memory manager detects a severe error. MSDN lists a number of possibilities for parameter 1, but the majority of the possibilities listed identify some sort of corruption of the memory management data structures. The minority of listed codes deal with invalid allocation, references, or deallocation of memory or memory manager structures. In a lot of cases, the faulting module is listed as the NT kernel (ntoskrnl.exe, ntkrnlpa.exe, ntkrnlmp.exe, and ntkrnlpamp.exe). Below is an example of a minidump analysis,

0: kd> !analyze -v
*******************************************************************************
*                                                                             *
*                        Bugcheck Analysis                                    *
*                                                                             *
*******************************************************************************

MEMORY_MANAGEMENT (1a)
    # Any other values for parameter 1 must be individually examined.
Arguments:
Arg1: 0000000000000403, The subtype of the bugcheck.
Arg2: fffff680000697c8
Arg3: adc000002877c867
Arg4: bffff680000697c8

Debugging Details:
------------------


BUGCHECK_STR:  0x1a_403

CUSTOMER_CRASH_COUNT:  1

DEFAULT_BUCKET_ID:  VISTA_DRIVER_FAULT

PROCESS_NAME:  AvastSvc.exe

CURRENT_IRQL:  0

LAST_CONTROL_TRANSFER:  from fffff80002ae7628 to fffff80002a755c0

STACK_TEXT:  
... : nt!KeBugCheckEx
... : nt! ?? ::FNODOBFM::`string'+0x31eb2
... : nt!MiDeleteVirtualAddresses+0x408
... : nt!NtFreeVirtualMemory+0x5ca
... : nt!KiSystemServiceCopyEnd+0x13
... : 0x7760f89a


STACK_COMMAND:  kb

FOLLOWUP_IP: 
nt! ?? ::FNODOBFM::`string'+31eb2
fffff800`02ae7628 cc              int     3

SYMBOL_STACK_INDEX:  1

SYMBOL_NAME:  nt! ?? ::FNODOBFM::`string'+31eb2

FOLLOWUP_NAME:  MachineOwner

MODULE_NAME: nt

IMAGE_NAME:  ntkrnlmp.exe

DEBUG_FLR_IMAGE_TIMESTAMP:  4e02aa44

FAILURE_BUCKET_ID:  X64_0x1a_403_nt!_??_::FNODOBFM::_string_+31eb2

BUCKET_ID:  X64_0x1a_403_nt!_??_::FNODOBFM::_string_+31eb2

Followup: MachineOwner
---------
 
 
This particular issue was likely caused by Avast antivirus (see PROCESS_NAME above). It is common for Antivirus software from Norton, McAfee, Trend, AVG, and others to cause this issue.

If a specific driver is listed as a faulting module and the error code listed in parameter 1 is known, then this driver should be examined and either upgraded, downgraded, or disabled. If the error code listed in parameter 1 points to corruption or is unknown, initially troubleshoot the issue as a memory error, and enable driver verifier if no memory errors are detected.

See Also,
Windows Crash Dump Analysis
How to Perform an Offline Integrity Check
How to Disable and Enable Windows Device Drivers
Troubleshooting Memory Errors

How to Perform an Offline System Integrity Verification


This article primarily applies to Windows XP, Windows Server 2003, Windows Vista, Windows Server 2008, Windows 7, and Windows Server 2008 R2.

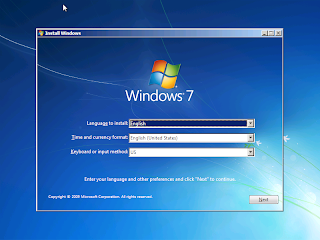
Various system issues can prevent a system from booting properly and can be fixed through an offline file system check and an integrity check/repair of critical operating system files. To perform this check, it is necessary to access the recovery console from the Windows installation media. I will demonstrate this using the Windows 7 ISO,

First, boot the system from the Windows installation disk,


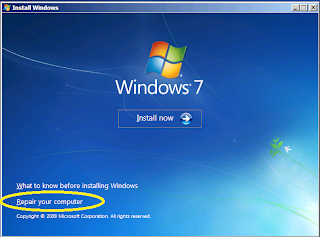
Then click on "Repair Your Computer"


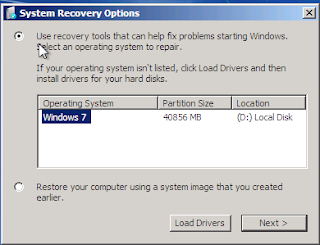
Select the installation of Windows that you want to mount


Open the command prompt


First, lets use the command line to identify all drives attached to the system and their current mount point in Windows PE. This is done with the diskpart utility and the list volumes subcommand. C:\ is the boot volume (labeled "System Reserved") and D:\ is the system volume (where the operating system and user data are stored)


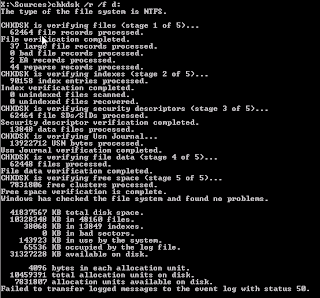
We will start with a chkdsk, this will verify/repair the filesystem and mark any bad sectors on the disk so that they are not used again.


Next, we will perform a sfc /scannow using the offline settings for the boot directory and windows directory. If you use the incorrect options, two errors are common,

"Windows Resource Protection could not start the Repair service."

"There is a system repair pending which requires reboot to complete. Restart Windows and run sfc again."

The first error indicates an invalid boot or system partition path. The second indicates that incorrect arguments wre given, or there is a file that needs to be removed or renamed in the \Windows\winsxs\pending.xml path. For this installation, this is D:\Windows\winsxs\pending.xml.

For this particular system, this is the correct command to run based on the output of diskpart above

sfc /SCANNOW /OFFBOOTDIR=c:\ /OFFWINDIR=d:\Windows


With any luck the system will boot correctly after this point and repair operations can continue. If the system is still unbootable, it may be necessary to perform an in place upgrade or rescue the files and reformat the system.

See Also,
Windows Blue Screen Crash Dump Analysis
Troubleshooting Memory Errors
How To Detect a Failing Hard Drive
Accessing Safe Mode in Windows
How to Edit the Registry of an Offline Windows System


Sunday, December 18, 2011

Router on a Stick With GNS3

"Router on a stick" is a common introductory networking pattern that utilizes 2 or more hosts (on separate VLANs) and a switch with a trunk port to a router. This is a common introductory scenario utilized in the CCNA and CCNP training materials. It is also likely utilized in a number of it training courses for internetworking technologies.

To demonstrate a simple Cisco router on a stick configuration, I utilize a Cisco c3725 configured as a switch, two linux hosts, and a Cisco c7200 router to act as the gateway between the networks. The host named 172Host has the IP address 172.16.1.2/24 and its connected switch port is on VLAN 1. VLAN 2 host the 192Host with IP address 192.168.0.2/24. The c7200 has two subinterfaces on fa0/0: FastEthernet 0/0.1 with IP address 172.16.0.1/24 and FastEthernet 0/0.2 with IP address 192.168.0.1/24. The FastEthernet 0/0 interface is connected to the FastEthernet 1/2 port on the switch and this port is configured for trunking (using 802.1q encapsulation).


172Host and 192Host are Linux systems, the important pieces of the configuration are shown below (this can be verified using the ifconfig -a and the route command). This includes setting the IP address and default gateway.

root@192Host:~# ifconfig eth0 192.168.0.2 mask 255.255.255.0
root@192Host:~# route add default gw 192.168.0.1 eth0

root@172Host:~# ifconfig eth0 172.16.0.2 mask 255.255.255.0
root@172Host:~# route add default gw 172.16.0.1 eth0 
 
The important pieces of the configuration on R1 and S1 are shown below,
PRef
 
!!!!!!!!!!!!!
! On S1     !
!!!!!!!!!!!!! 
!
interface FastEthernet1/0
!
interface FastEthernet1/1
 switchport access vlan 2
!
interface FastEthernet1/2
 switchport mode trunk
!
!!!!!!!!!!!!!
! On R1     !
!!!!!!!!!!!!!
interface FastEthernet0/0
 no ip address
 duplex auto
 speed auto
!
interface FastEthernet0/0.1
 encapsulation dot1Q 1 native
 ip address 172.16.0.1 255.255.255.0
!
interface FastEthernet0/0.2
 encapsulation dot1Q 2
 ip address 192.168.0.1 255.255.255.0
!
  
After the configuration is complete, a full inter-VLAN routing solution is complete and 172Host and 192Host can successfully ping each other.

root@172Host:~# ping -c 4 192.168.0.2
PING 192.168.0.2 (192.168.0.2): 56 data bytes
64 bytes from 192.168.0.2: seq=0 ttl=63 time=18.025 ms
64 bytes from 192.168.0.2: seq=1 ttl=63 time=24.678 ms
64 bytes from 192.168.0.2: seq=2 ttl=63 time=21.445 ms
64 bytes from 192.168.0.2: seq=3 ttl=63 time=17.711 ms

--- 192.168.0.2 ping statistics ---
4 packets transmitted, 4 packets received, 0% packet loss
round-trip min/avg/max = 17.711/20.464/24.678 ms

root@192Host:~# ping -c 4 172.16.0.2
PING 172.16.0.2 (172.16.0.2): 56 data bytes
64 bytes from 172.16.0.2: seq=0 ttl=63 time=17.665 ms
64 bytes from 172.16.0.2: seq=1 ttl=63 time=14.784 ms
64 bytes from 172.16.0.2: seq=2 ttl=63 time=22.809 ms
64 bytes from 172.16.0.2: seq=3 ttl=63 time=18.777 ms

--- 172.16.0.2 ping statistics ---
4 packets transmitted, 4 packets received, 0% packet loss
round-trip min/avg/max = 14.784/18.508/22.809 ms
 
 
See Also,
Connect GNS3 and Hyper-V
Emulating a Managed Switch with Dynamips/GNS3
The Road to the CCIE

Saturday, December 17, 2011

Emulating a Managed Switch With Dynamips/GNS3

To clarify one thing at the beginning, there is no version of dynamips or GNS3 currently that has the capability of running a Cisco Switch IOS image. Why is this? Cisco has designed a number of application specific integrated circuits (ASICs) that have not been reversed engineered by the Dynamips team or anyone else in the community to create a viable software emulation. GNS3 and Dynamips are not good testing and training platforms for the CCNA, CCNP, or CCIE switching topics and not good tools for any IT training courses that need to cover switching related exam objectives.

There are ways to perform some of the important features of the layer 2 network that managed switches provide when working with a routed (layer 3) network in GNS3. In this post, I will show how a Cisco c3725 with an NM-16ESW module can be configured to perform specific layer 2 functions such as Spanning Tree Protocol (IEEE [802.1d], but not Rapid STP [802.1w] or Multipe STP [802.1s]), VLANs, VLAN Trunking, VLAN Trunk Protocol (VTP). In all of the examples, I will be working with the following topology using the Advanced Enterprise Services version of 12.4(15)T7,


The connections are configured this way...

S0 - FastEthernet 1/0 S1 - FastEthernet 1/0
S0 - FastEthernet 1/1 S1 - FastEthernet 1/1
S0 - FastEthernet 1/2 S2 - FastEthernet 1/0
S0 - FastEthernet 1/3 S2 - FastEthernet 1/1
S1 - FastEthernet 1/2 S2 - FastEthernet 1/2
S1 - FastEthernet 1/3 S2 - FastEthernet 1/3

Let's get started with the basics of the layer 2 network.

Configuring the NM-16ESW for Switch-mode Operation

Use the switchport command to make the ports switched (rather than routed) ports,
S0(config)#interface range fastethernet 1/0 - 15
S0(config-if-range)#switchport

Virtual Local Area Networks (VLANs)

VLANs allow broadcast domains to be isolated to specific ports across a number of switches in a layer 2 topology. Multiple VLANs travel across a single link using a trunking protocol such as the industry standard 802.1Q or the Cisco-proprietary Inter-Switch link (ISL). The familiar commands from the global configuration mode of the router are available to configure VLANs and VLAN Trunking Protocol (VTP) settings. In this example I configure 2 VLANS named MikesBlog (10) and Internet (20) on all of the routers. Based on many industry recommendations, I configure the switches to be in VTP transparent mode (effectively disabling VTP on the particular switch, but allowing VTP frames to be forwarded through the switch for switches that support VTP version 2).

;
;Configuration on S0, this is the same on S1 and S2
;
S0(config)#vtp mode transparent
Setting device to VTP TRANSPARENT mode.
S0(config)#vlan 10
S0(config-vlan)#name MikesBlog
S0(config-vlan)#vlan 20
S0(config-vlan)#name Internet 

Unlike a switch, there is no show vlan command on the router IOS.     The show vlan-switch command is used instead

S0#show vlan-switch

VLAN Name                             Status    Ports
---- -------------------------------- --------- -------------------------------
1    default                          active    Fa1/1, Fa1/2, Fa1/3, Fa1/4
                                                Fa1/5, Fa1/6, Fa1/7, Fa1/8
                                                Fa1/9, Fa1/10, Fa1/11, Fa1/12
                                                Fa1/13, Fa1/14, Fa1/15
10   MikesBlog                        active    Fa1/0
20   Internet                         active
1002 fddi-default                     act/unsup
1003 token-ring-default               act/unsup
1004 fddinet-default                  act/unsup
1005 trnet-default                    act/unsup

VLAN Type  SAID       MTU   Parent RingNo BridgeNo Stp  BrdgMode Trans1 Trans2
---- ----- ---------- ----- ------ ------ -------- ---- -------- ------ ------
1    enet  100001     1500  -      -      -        -    -        1002   1003
10   enet  100010     1500  -      -      -        -    -        0      0
20   enet  100020     1500  -      -      -        -    -        0      0
1002 fddi  101002     1500  -      -      -        -    -        1      1003
1003 tr    101003     1500  1005   0      -        -    srb      1      1002
1004 fdnet 101004     1500  -      -      1        ibm  -        0      0
1005 trnet 101005     1500  -      -      1        ibm  -        0      0 

Trunking is different on the router IOS. Dynamic Trunking Protocol     is not supported,  so there is no switchport mode dynamic desirable     or switchport mode dynamic auto command. 

S0(config-if)#switchport mode ?
  access  Set trunking mode to ACCESS unconditionally
  trunk   Set trunking mode to TRUNK unconditionally 
 

Spanning Tree Protocol

Spanning Tree Protocol was developed to help prevent layer 2 loops within a network that has redundant links. For the c3725 image that I used, the spanning tree mode command was not available, so the only spanning tree mode that is available is 802.1d (known in Cisco IOS as Per-VLAN Spanning Tree, PVST+).

Ultimately, GNS3 and Dynamips are good tools for building and troubleshooting router configurations, but switch configuration testing requires actual Cisco switches. It is possible to connect to a Cisco switch using a host system interface and the cloud object in GNS3. This is a similar technique to this post.

See Also,
Connecting GNS3 and Hyper-V
Router on a Stick with GNS3
The Road to the CCIE 

Friday, December 16, 2011

How to Rescue Files From a Damaged System

An interesting event occurred the other day, I had one of the typical family support cases that most people in the IT industry have from time to time... I came home to my in-laws' computer sitting on my front door stoop and a voice mail saying something about a virus. I think to myself "Didn't I say that I don't support family systems..." Anyway, I boot it up and it is infected with a a interesting trojan called "Vista Home Security 2012." This is a trojan that makes a number of registry changes that force applications such as the command shell (cmd.exe), firefox, registry editor (regedit.exe), and other starting points for getting rid of it inaccessible by making the virus launch instead of the application. This occurs even in safe mode. To make matters worse for a home user, it hides all of the user's documents so that the user believes that they have been deleted. 

I researched it and there are published ways for cleaning the virus off of the system, but in the case of a severe virus infection, I prefer to securely erase the hard drive and start over. Since I have data that needs to be saved, I'll use antivirus software on the next reinstall of Windows to clean the files, but for now I need to get them off of the PC without accessing Windows.

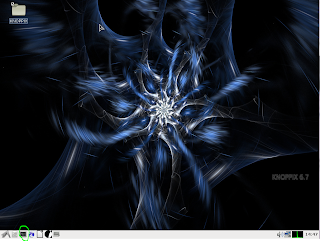
I made sure that I had a USB flash drive or USB hard drive that was large enough to store the data that needed to be saved. On a non-infected machine, I also downloaded a Linux Live CD (I used Knoppix in this case, but any distribution with a Live CD and the ability to mount, create, and edit NTFS volumes will work) and burned it to DVD. Many other users use Ubuntu, but I typically use Knoppix because it was the first live CD that I was exposed to. Here's where we will pick up the "how to" piece of this blog

I've used this procedure on virtually every modern version of Windows (Windows XP, Windows Server 2003, Windows Vista, Windows Server 2008, Windows 7, Windows Server 2008 R2, and Windows 8 Developer Preview).

Rescuing data using a Linux Live CD is useful in the following scenarios
- Corrupted/unbootable operating system
- Systems with failing hard drives where it is preferred to minimize the I/O activity on the disk to save the data
- Severe virus/malware infection
- Accessing the contents of a filesystem that you do not have permissions to access (ex. accessing a sysadmin's laptop after he/she leaves the company)
- Systems that crash where the data is not backed up

Boot the system where the data needs to be recovered from the Linux Live CD.


Hit enter and load the Operating System to access the desktop. Open a couple of terminal windows.


Use the kernel log to identify the drive that Windows is on (it usually starts with hd or sd and you can identify it by the size of the drive),

 
knoppix@Microknoppix:~$ dmesg | egrep "hd|sd" 
[    0.925358] sd 0:0:0:0: [sda] 41943040 512-byte logical blocks: (21.4 GB/20.0 GiB)
[    0.925388] sd 0:0:0:0: [sda] Write Protect is off
[    0.925389] sd 0:0:0:0: [sda] Mode Sense: 00 3a 00 00
[    0.925402] sd 0:0:0:0: [sda] Write cache: enabled, read cache: enabled, 
                                 doesn't support DPO or FUA
[    0.925876] sd 0:0:0:0: Attached scsi generic sg0 type 0
[    0.961321]  sda: sda1 sda2
[    0.961584] sd 0:0:0:0: [sda] Attached SCSI disk 


It is also clear that the hard drive has two partitions, sda1 is the Windows boot partition and sda2 is the Windows system partition (this is where the user data most likely resides).

[    0.961321]  sda: sda1 sda2

The next steps require root access, so perform a switch user (su) to root,
 
knoppix@Microknoppix:~$ su - 
root@Microknoppix:~#  

From here, we want to create a temporary directory to mount the Windows system's C:\ drive (/dev/sda2) to and mount the partition,
 
root@Microknoppix:~# cd / 
root@Microknoppix:/# mkdir old_windows 
root@Microknoppix:/# mount -t ntfs /dev/sda2 /old_windows  

Now, let's see if our files are out there,


Since the volume mounted properly, the user specific data (including My Documents, My Pictures, My Downloads, etc) is now located in /old_windows/Users. Now, let's insert the flash drive and get ready to pull the data off. Insert the flash drive and run dmesg again, this time the hard drive information should appear at the end.

root@Microknoppix:~$ dmesg 
[ 1470.286199] usb 1-1: SerialNumber: 812520090519
[ 1470.297467] scsi3 : usb-storage 1-1:1.0
[ 1471.320076] scsi 3:0:0:0: Direct-Access     USB Mass Storage Device 
                             PQ: 0 ANSI: 0 CCS
[ 1471.325288] sd 3:0:0:0: Attached scsi generic sg2 type 0
[ 1471.355487] sd 3:0:0:0: [sdb] 3842048 512-byte logical blocks: (1.96 GB/1.83 GiB)
[ 1471.364823] sd 3:0:0:0: [sdb] Write Protect is off
[ 1471.364829] sd 3:0:0:0: [sdb] Mode Sense: 03 00 00 00
[ 1471.373389] sd 3:0:0:0: [sdb] No Caching mode page present
[ 1471.373395] sd 3:0:0:0: [sdb] Assuming drive cache: write through
[ 1471.421455] sd 3:0:0:0: [sdb] No Caching mode page present
[ 1471.421461] sd 3:0:0:0: [sdb] Assuming drive cache: write through
[ 1471.431030]  sdb: sdb1
[ 1471.484867] sd 3:0:0:0: [sdb] No Caching mode page present
[ 1471.484872] sd 3:0:0:0: [sdb] Assuming drive cache: write through
[ 1471.484878] sd 3:0:0:0: [sdb] Attached SCSI removable disk 

In this case, let's assume that we are going to be creating a large     archive and need to have files larger than 2 GB. We will need to     reformat the drive to use ntfs using fdisk on /dev/sdb (the flash     drive).

#cd / 
#fdisk /dev/sdb
WARNING: DOS-compatible mode is deprecated. It's strongly recommended to
         switch off the mode (command 'c') and change display units to
         sectors (command 'u').

Command (m for help): o
Building a new DOS disklabel with disk identifier 0x47ad9ab9.
Changes will remain in memory only, until you decide to write them.
After that, of course, the previous content won't be recoverable.

Warning: invalid flag 0x0000 of partition table 4 will be corrected by w(rite)

WARNING: DOS-compatible mode is deprecated. It's strongly recommended to
         switch off the mode (command 'c') and change display units to
         sectors (command 'u').

Command (m for help): n
Command action
   e   extended
   p   primary partition (1-4)
p
Partition number (1-4): 1
First cylinder (1-1203, default 1): 
Using default value 1
Last cylinder, +cylinders or +size{K,M,G} (1-1203, default 1203): 
Using default value 1203

Command (m for help): w
The partition table has been altered!

Calling ioctl() to re-read partition table.
Syncing disks. 

root@Microknoppix:/# mkfs.ntfs /dev/sdb1  
Cluster size has been automatically set to 4096 bytes.
Initializing device with zeroes: 100% - Done.
Creating NTFS volume structures.
mkntfs completed successfully. Have a nice day.


After the filesystem is initialized, let's create another directory and mount the flash drive.

mkdir /flashdrive
mount -t ntfs /dev/sdb1 /flashdrive 
 
Now create an archive containing all of the home directories for users of the Windows system (or the specific directories that you need... whatever the case).

tar czvf /flashdrive/save_data.tar.gz /old_windows/Users 
 
Now verify that the files are in the archive and unmount the flash drive and the Windows partition. If you are still in the /flashdrive directory with your terminal, you may get a device busy message. Simply cd to /.
 
tar tzvf /flashdrive/save_data.tar.gz
umount /flashdrive
umount /old_windows 

Now remove the flash drive. We will now securely erase all of the data, including the master boot record, on the infected hard drive using the shred command. Note that if you are using this procedure for a failing disk (and not an infected system), this is an optional step. A fun note here is that a parameter between 7 and 35 for the -n parameter of the shred command is considered to be secure erasure of the disk. To be quick, I simply overwrote the data on disk twice, once with a random pattern and once with 0s.

shred -z -v -n 1 /dev/sda
 
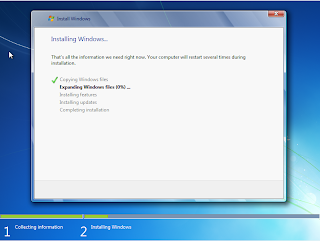
Now reboot the system and reinstall Windows, but do not insert the flash drive until after we have installed an antivirus, performed updates, and created a non-privileged account to extract the files and begin the virus scan.


After installing all updates and installing an antivirus, install 7-zip and extract the archive to the disk. Run antivirus scans to make sure that any viruses resident in the files are detected and removed. Note that there is some risk of reinfection here because antivirus software does not pick up all of the variants of all known malware and viruses.


You may need to extract it again if it creates a saved_data.tar file instead of fully extracting the files. Before opening any of the files, run a full virus scan first. 

See Also,
Windows Crash Dump Analysis
How to Detect a Failing Hard Drive
How to Edit the Registry of an Offline Windows System